
Page Size Monitoring. A 200 OK Proves Nothing.
A status code only tells you the server answered, not that the right page shipped. Monitor HTML payload size per endpoint and catch partial renders, injected code and bloated releases before your client spots the regression.
Made and Hosted in the
European Union
GDPR-Compliant Hosting
in Germany
GEO-Redundant Replica
across the EU
The Status Code Lies. The Byte Count Doesn't.
A page can answer a clean 200 and still be broken: half-rendered, missing a content block, or quietly failing in the backend. Page Size Check measures what actually leaves the server: the real size of the response body. That gives you a structural signal for whether the HTML you shipped still matches the page your client expects.
- HTML payload in bytes, so you stop leaning on the status code as your only health signal and start reading the substance of the response.
- Structural drift detection, so you catch missing content blocks, broken templates and silent failures before they turn into a ticket.
- Per-endpoint baseline, so every critical page in your portfolio carries its own expected byte corridor instead of one blanket rule.
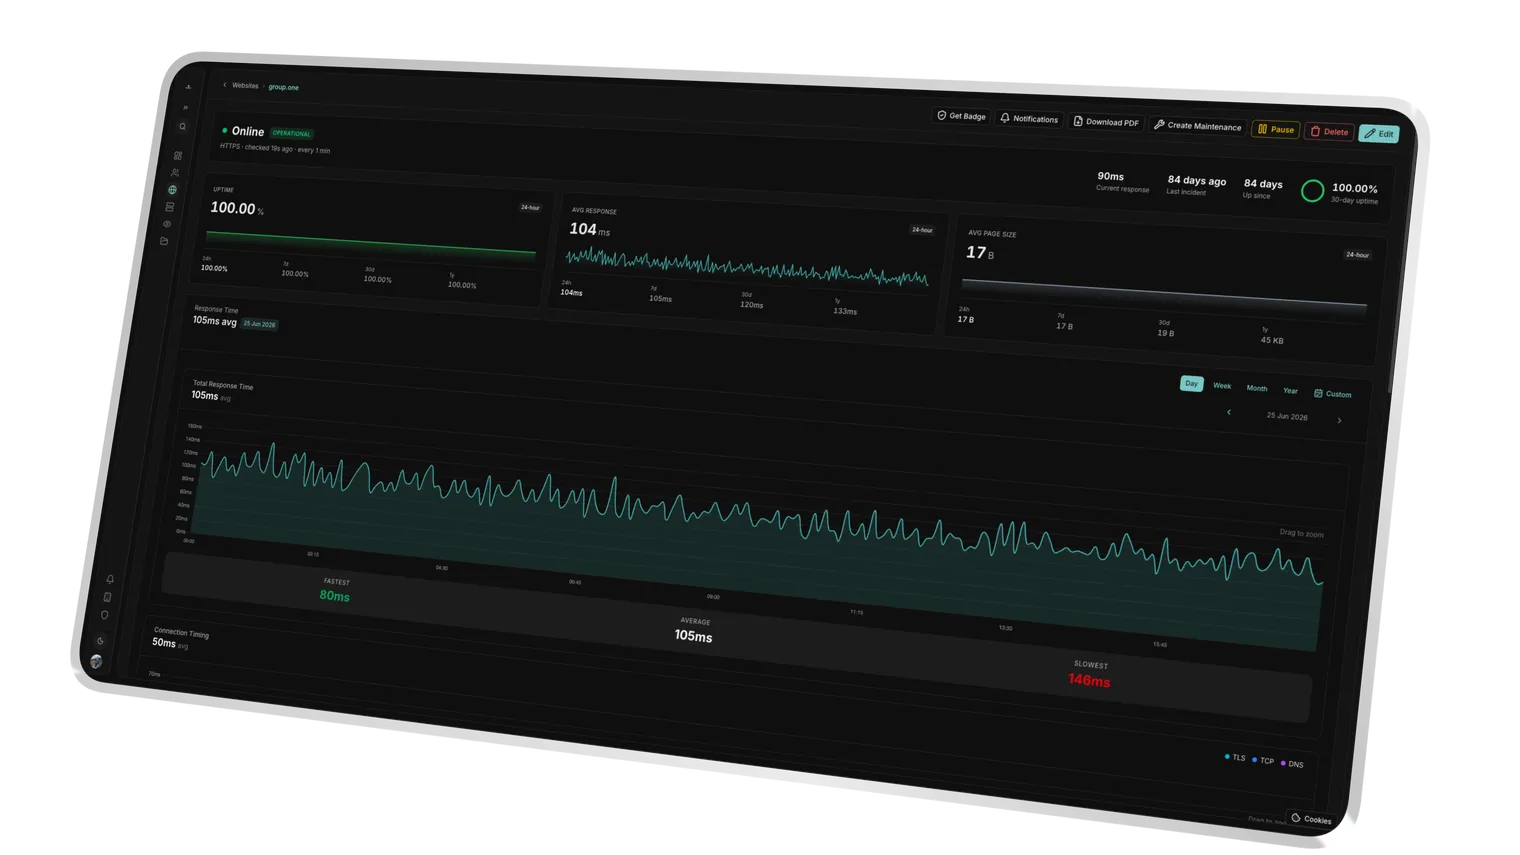
Content size is recorded per run, independent of the response status code.
An expected byte corridor is established per endpoint for comparison.
Measures the HTML document the server returns, before client-side assets load.
Min and Max. One Corridor, Two Guards.
Too small and too large are different failures. You set clear lower and upper bounds for critical landing pages, logins or checkout routes. Uptimeify checks every run against that corridor and flags anomalies on the spot, with no historical graph data to store.
- Min threshold, so you catch empty states, partial renders and template failures the moment a page drops below its normal size.
- Max threshold, so abnormal payload growth from unoptimized assets, injected snippets or runaway embeds never slips past you.
- Limit corridor, so the monitor only fires when the payload truly falls outside your bounds, not on every harmless fluctuation.
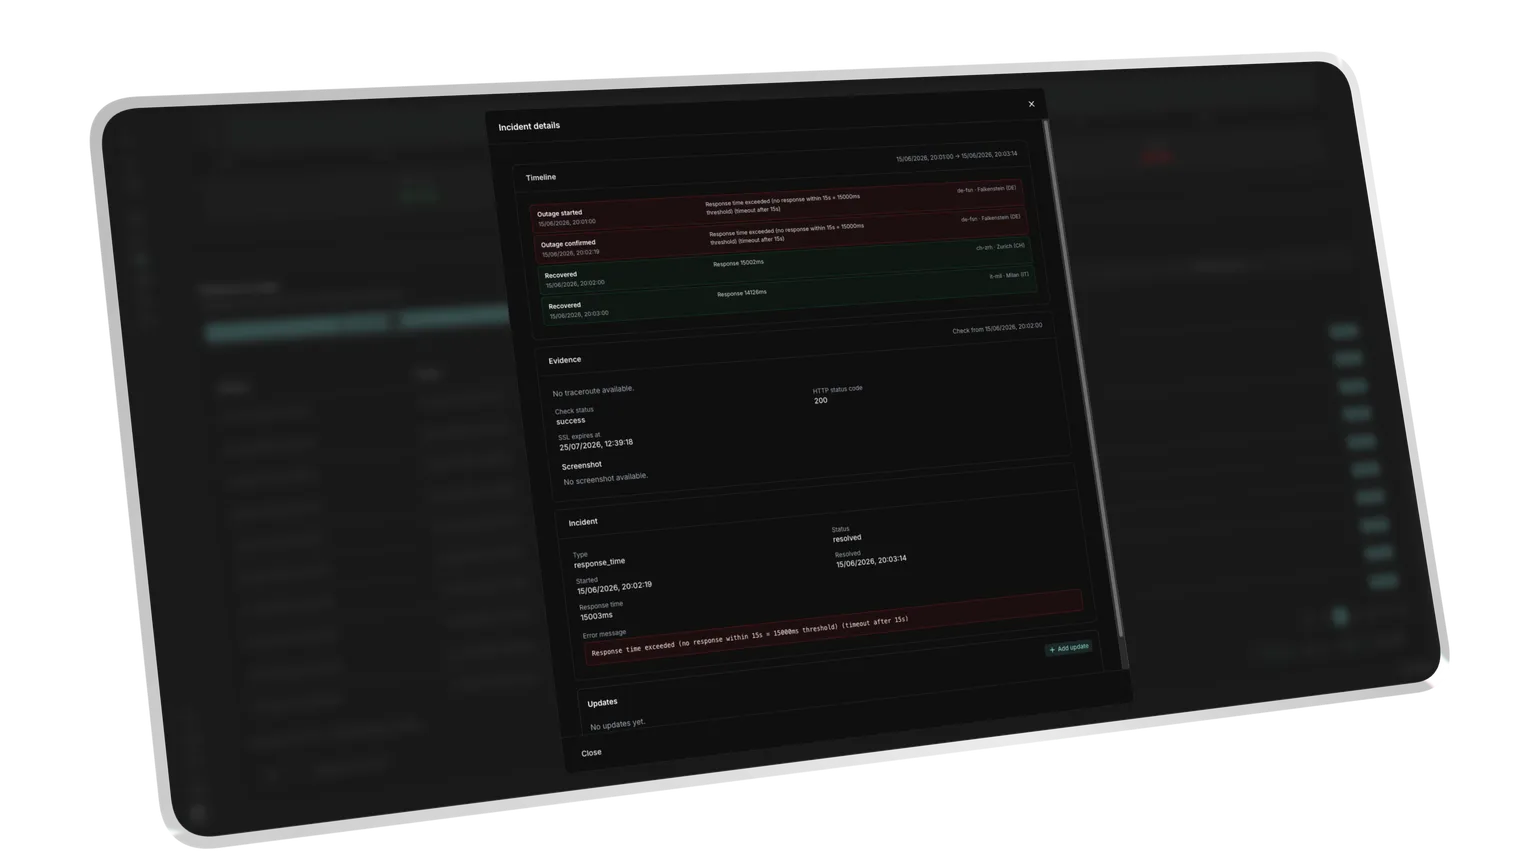
The monitor fails only when the payload leaves your chosen byte range.
Each run is judged against the corridor live, no historical graph needed.
Defacement and Bloat. You Catch Both at the Size.
Page Size Check defends integrity and performance at once. You catch defacements, broken render paths and bloated releases by their byte signature, before they become a visible incident your client reports first.
- Defacement defense, so you capture suspicious payload spikes that often ride in with malware, spam links or unauthorized scripts.
- Empty-render protection, so you catch pages dropping below their normal size when content blocks fail to render, even though the server answers fine.
- Performance ceiling, so accidental code bloat doesn't quietly wreck your Core Web Vitals, crawl efficiency and user experience.
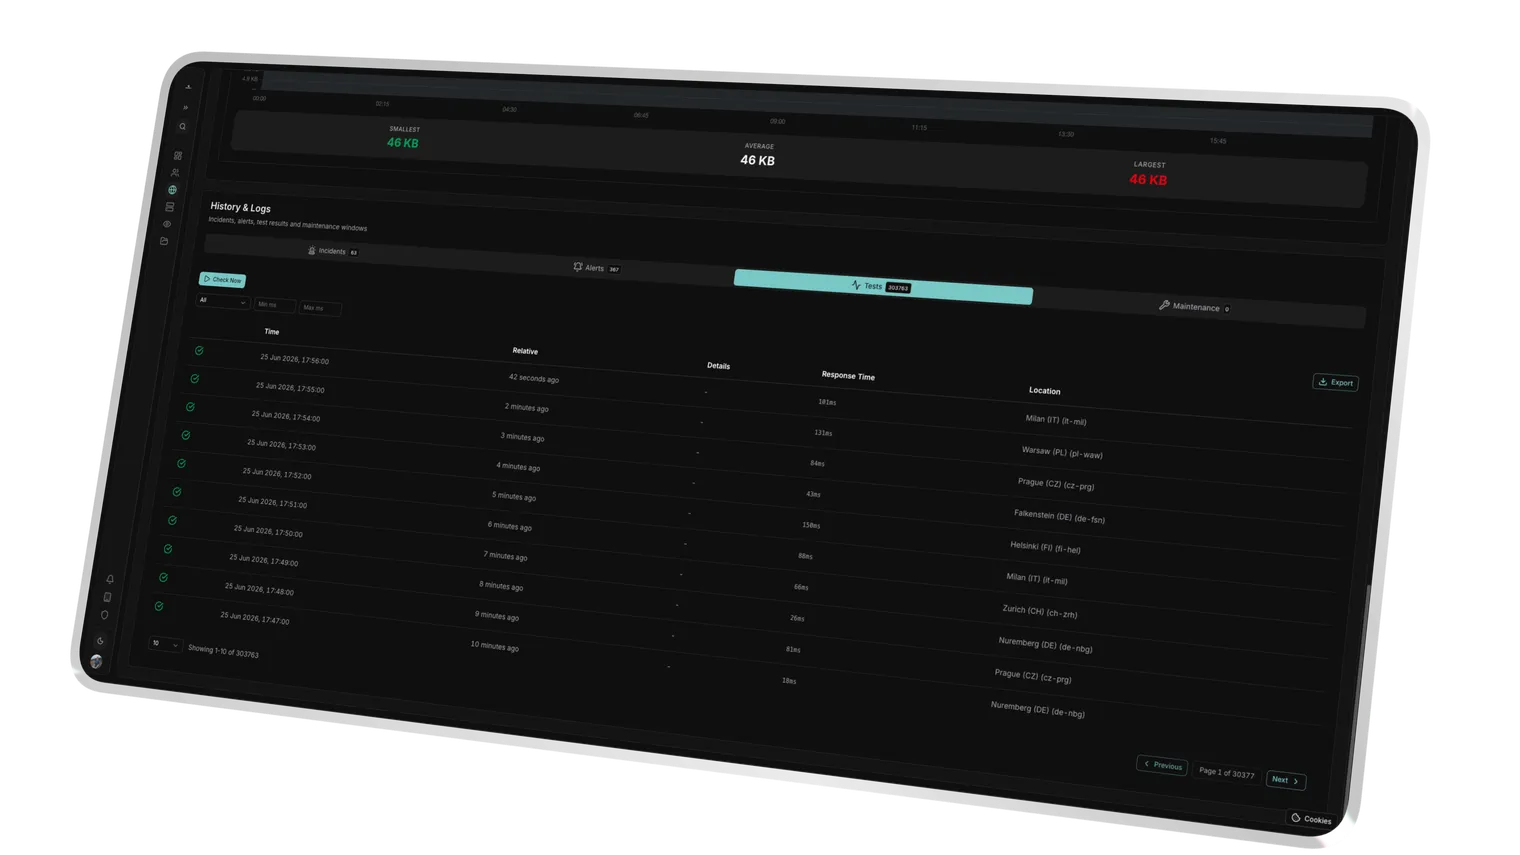
Sudden payload spikes often accompany injected malware or unauthorized scripts.
A drop below the normal footprint flags content blocks that failed to render.
Bloat that would hurt Core Web Vitals and crawl efficiency is caught early.
A size anomaly opens an incident before it ever becomes client-facing.
Success Kit
We don't just monitor. We help you sell.
Every Uptimeify subscription includes access to our Success Kit, a collection of battle-tested resources to turn your monitoring into a profit center.
Service Level Agreement templates to define professional boundaries with your clients.
Find the sweet spot for your care plans. Calculate margins based on check frequency and support hours.
Powerpoint Templates that explain 24/7 monitoring to non-technical clients. Close more retainers.
Use automated reports to proactively communicate value, so clients never ask what they're paying for.
Ready to turn monitoring into a profit center?
Claim your Success Kit and start scaling today.
Frequently Asked Questions
A 200 only confirms the server answered, not that the right page arrived. When a content block goes missing, a template aborts or someone injects foreign code, the status code often stays green anyway. The payload size shifts in all of these cases, so you catch structural defects through the bytes that the status code waves through.
You define a byte corridor with a lower and upper bound per endpoint. The lower bound catches empty states and partial renders; the upper bound catches abnormal growth from bloat or injections. Every run is checked against that corridor. The monitor only fires when the size falls outside your defined bounds, so you don't get false alarms on harmless fluctuations.
Yes. Unauthorized scripts, spam links or foreign embeds grow the payload measurably, often before the tampering shows visually. A size spike above your upper bound fires immediately, so you catch a compromise at the byte signal instead of when a client reports the defaced page.
No. The check is stateless: every run is evaluated against your fixed byte corridor, not a rolling historical graph. You don't need to retain size time series. The corridor alone delivers the verdict "within limit" or "outside it".
Ready to See Broken Releases Before Your Client Does?
Set a byte corridor per critical page and let Uptimeify check every run against your bounds. Empty renders, bloat and defacements get flagged before they become an incident, under your brand.