Response Time Monitoring. Before your client feels it.
Measure every client site's response time down to the millisecond, TTFB and full transfer time, polled from Frankfurt and other EU nodes. You catch creeping performance loss long before it turns into a complaint.
Made and Hosted in the
European Union
GDPR-Compliant Hosting
in Germany
GEO-Redundant Replica
across the EU
Reachable isn't fast enough. Metrics.
A page that answers with 200 OK can still crawl, and your client's end user feels that first. Uptimeify measures not just whether the server responds, but how fast: raw server processing time, separated from the delivery of the full document. So you know where a page slows down before anyone picks up the phone.
- TTFB measurement, so you isolate server-side processing time and tell a sluggish backend apart from a sluggish network.
- Full transfer audit, so you see the time for the complete HTML document to land, and name the bottleneck instead of guessing.
- Performance baseline across every endpoint, so you run one measurable speed standard for your whole portfolio, not just for single pages.
Isolates DNS, connect, TLS handshake and server processing, the backend signal.
The full document download time exposes network and payload bottlenecks.
A consistent speed standard is recorded across the whole portfolio for comparison.
Defined limits. Real warning.
A fixed SLA number turns "feels slow" into a measurable promise. You set, per monitor, the response time where it gets tight, and Uptimeify warns you in stages, not only on a hard outage. The slow page stands out while it's still online.
- Millisecond thresholds, so you trigger warnings exactly when response time breaks your limit, say above 2,000 ms.
- Degraded status instead of silence, so your team sees a performance regression while the page is still up, rather than reacting only at total failure.
- Proactive alerting, so you find slow-loading pages before they eat into your client's conversion rate.
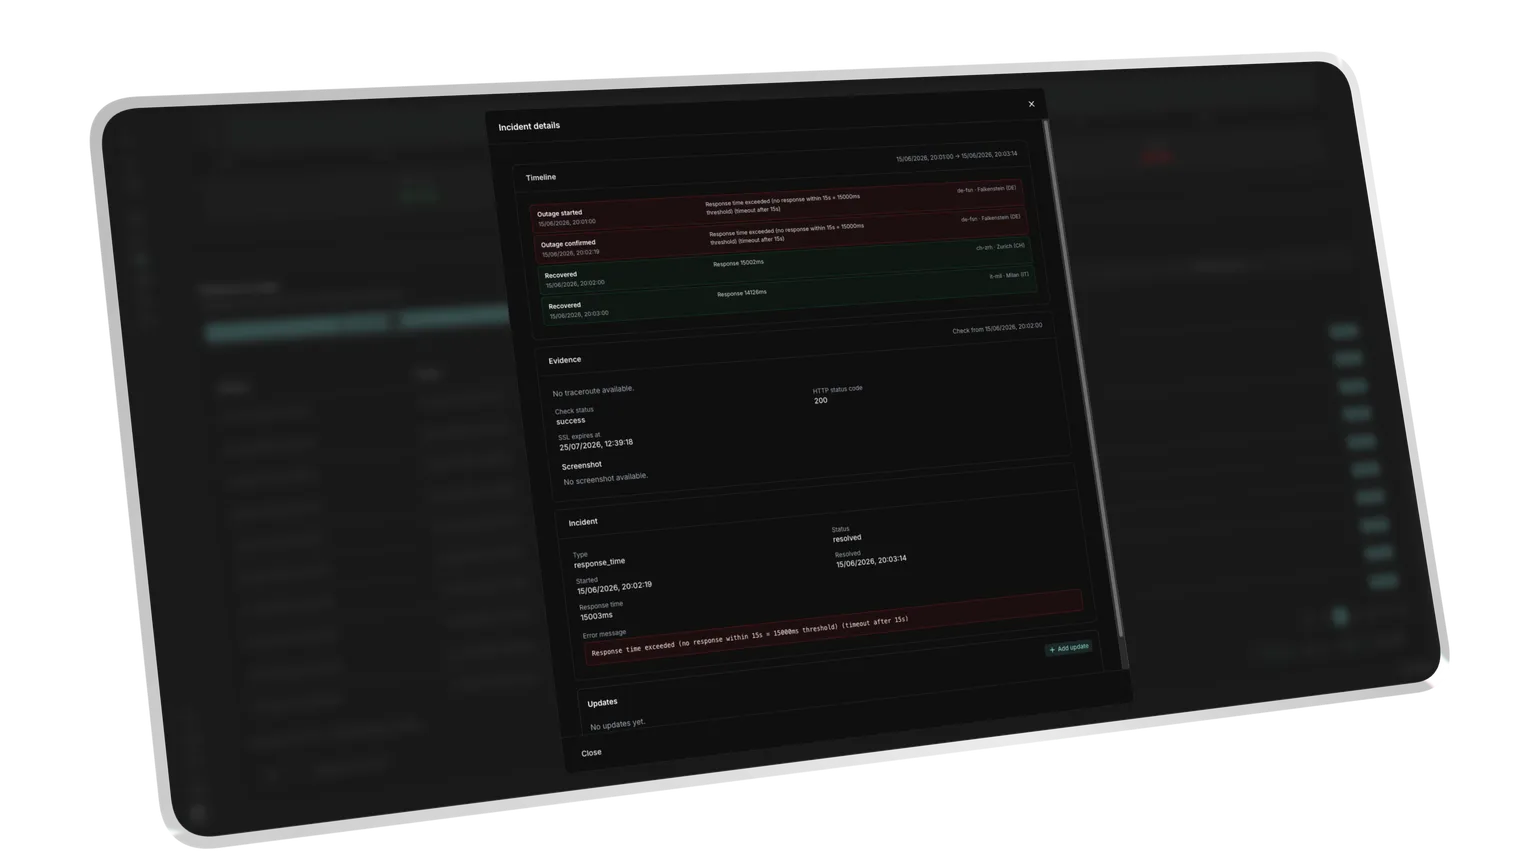
Crossing the limit flags the monitor as Degraded while it is still reachable.
A sustained breach opens a response_time incident, not just a one-off blip.
The monitor returns to OK once timings drop back under the threshold.
Every slowdown has a trigger.
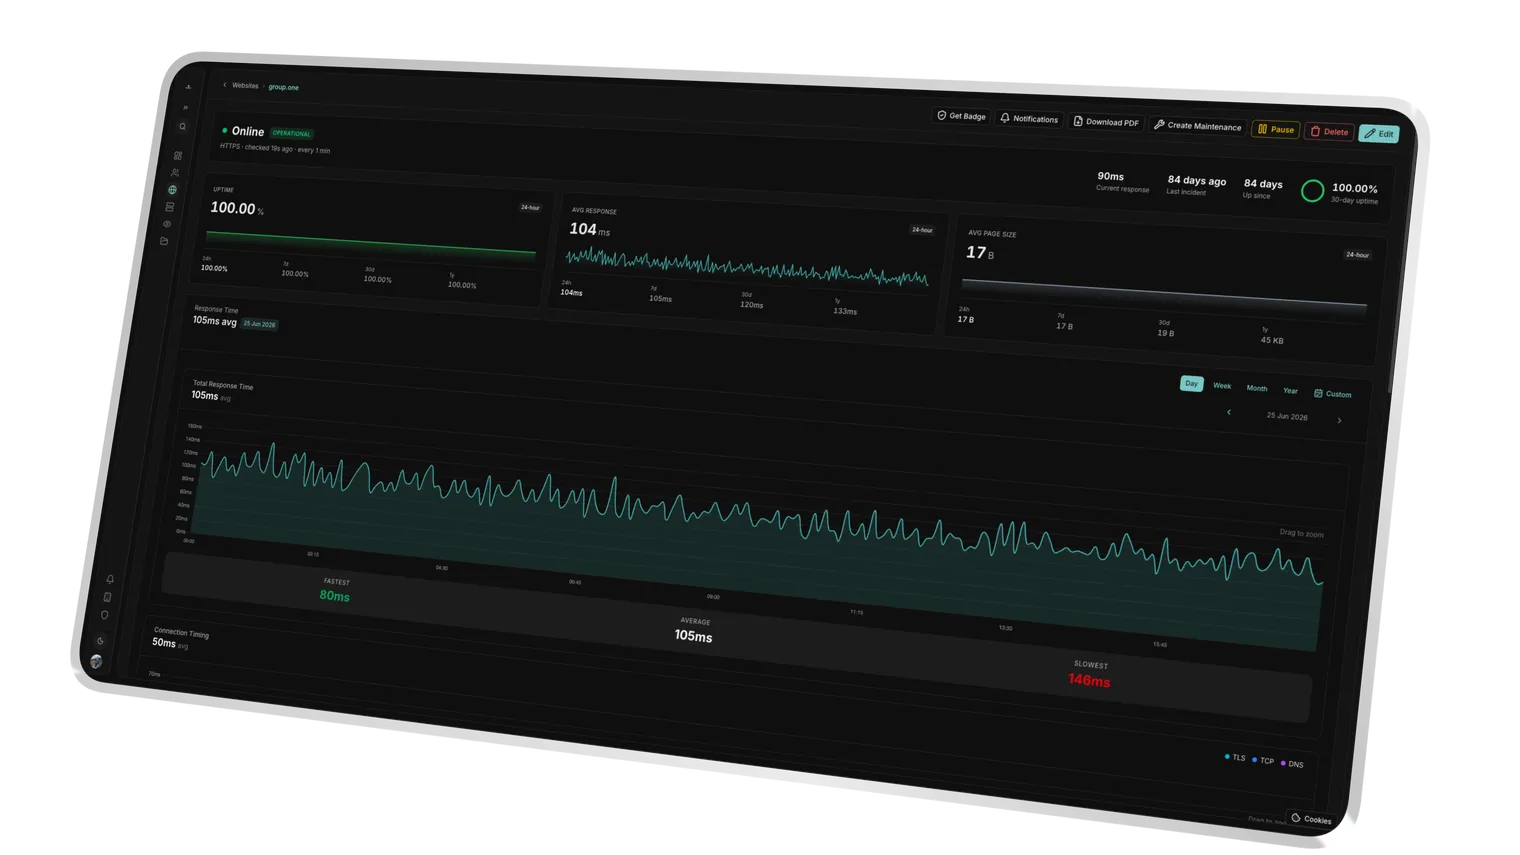
Performance rarely drops all at once, usually it creeps, after a deployment or under load. The telemetry charts plot response time over time and make the link visible: you correlate a speed dip with the release or server event that caused it, and walk into the client call with data instead of a hunch.
- Deployment impact, so you see a new release's effect on response time immediately and can prove it.
- Event auditing, so you tie performance dips during backups or database indexing to a specific job.
- Long-term trends, so you spot creeping performance decay over weeks, before it becomes a problem.
Spikes lined up with a release time make code or infra the obvious suspect.
Gradual drift surfaces slow infrastructure fatigue long before an outage.
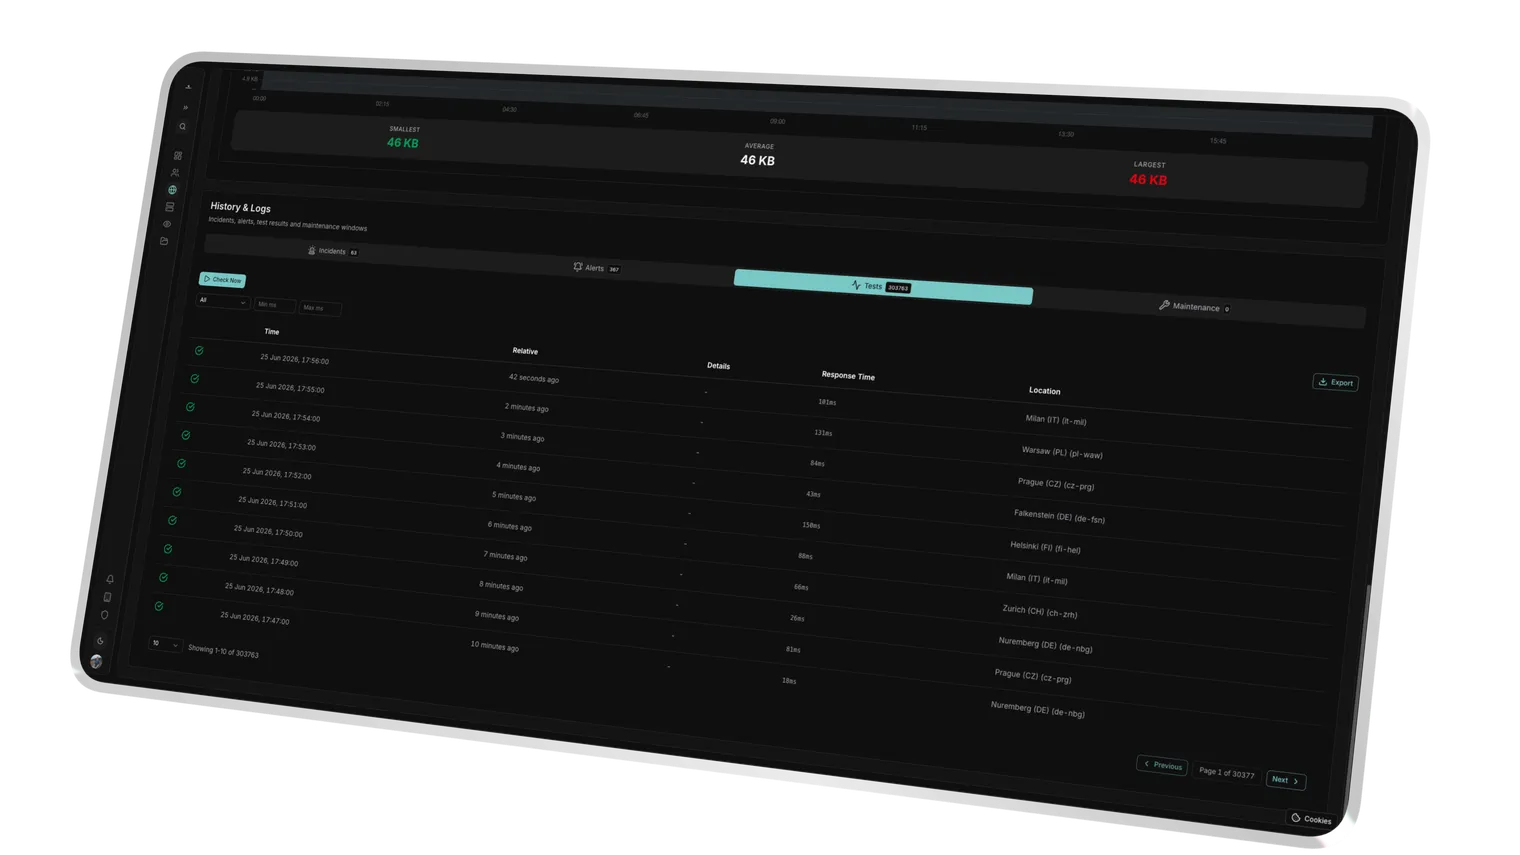
Each EU node's timing is recorded so regional slowdowns stand out.
Success Kit
We don't just monitor. We help you sell.
Every Uptimeify subscription includes access to our Success Kit, a collection of battle-tested resources to turn your monitoring into a profit center.
Service Level Agreement templates to define professional boundaries with your clients.
Find the sweet spot for your care plans. Calculate margins based on check frequency and support hours.
Powerpoint Templates that explain 24/7 monitoring to non-technical clients. Close more retainers.
Use automated reports to proactively communicate value, so clients never ask what they're paying for.
Ready to turn monitoring into a profit center?
Claim your Success Kit and start scaling today.
Frequently Asked Questions
Time to First Byte is the time until your server returns the first byte after the request, the raw server-side reaction time, before the document is even transferred. Uptimeify splits this value from the full transfer time so you can tell whether a page feels slow because of a sluggish backend or a slow download. That way you fix the right thing instead of optimizing the wrong end.
You set that yourself, per monitor. You define an OK limit and a critical limit in milliseconds; when response time crosses the critical limit (say 2,000 ms), Uptimeify raises an incident with alerting. Between the two sits the degraded zone, which warns you while the page is still online. So you get an early signal instead of just an outage notice.
Degraded means measurably slower than your OK limit, but not yet critical. The monitor stays online and reachable, but is visibly flagged "degraded" the moment response time crosses the OK limit. That lets your team catch a performance regression early enough to act, before the slow page turns into a complaint or a lost checkout.
From Frankfurt and other European monitoring nodes. Response time is determined across EU locations, with no US sub-processors in the measurement path. That keeps your comparison values stable, latency doesn't swing with changing transit routes across the Atlantic, and takes the data-location question off the table in B2B and public-sector conversations.
Yes. The performance data flows into the white-labeled PDF reports and onto the branded status pages, under your brand, your domain. So every month you prove in black and white that your client's sites aren't just online, but fast. A technical metric becomes an argument for your next retainer.
Ready to make speed the proof of your work?
Measure every client site's response time to the millisecond, set your own SLA limits, and catch the slow page before your client notices. One plan, your whole portfolio.