EU-Wide Uptime Monitoring. Zero False Alarms.
Validate your endpoints with European multi-node verification and full protocol control. Every outage gets confirmed across multiple EU locations before your client ever sees an alert, so you react to real incidents, not network flicker.
Made and Hosted in the
European Union
GDPR-Compliant Hosting
in Germany
GEO-Redundant Replica
across the EU
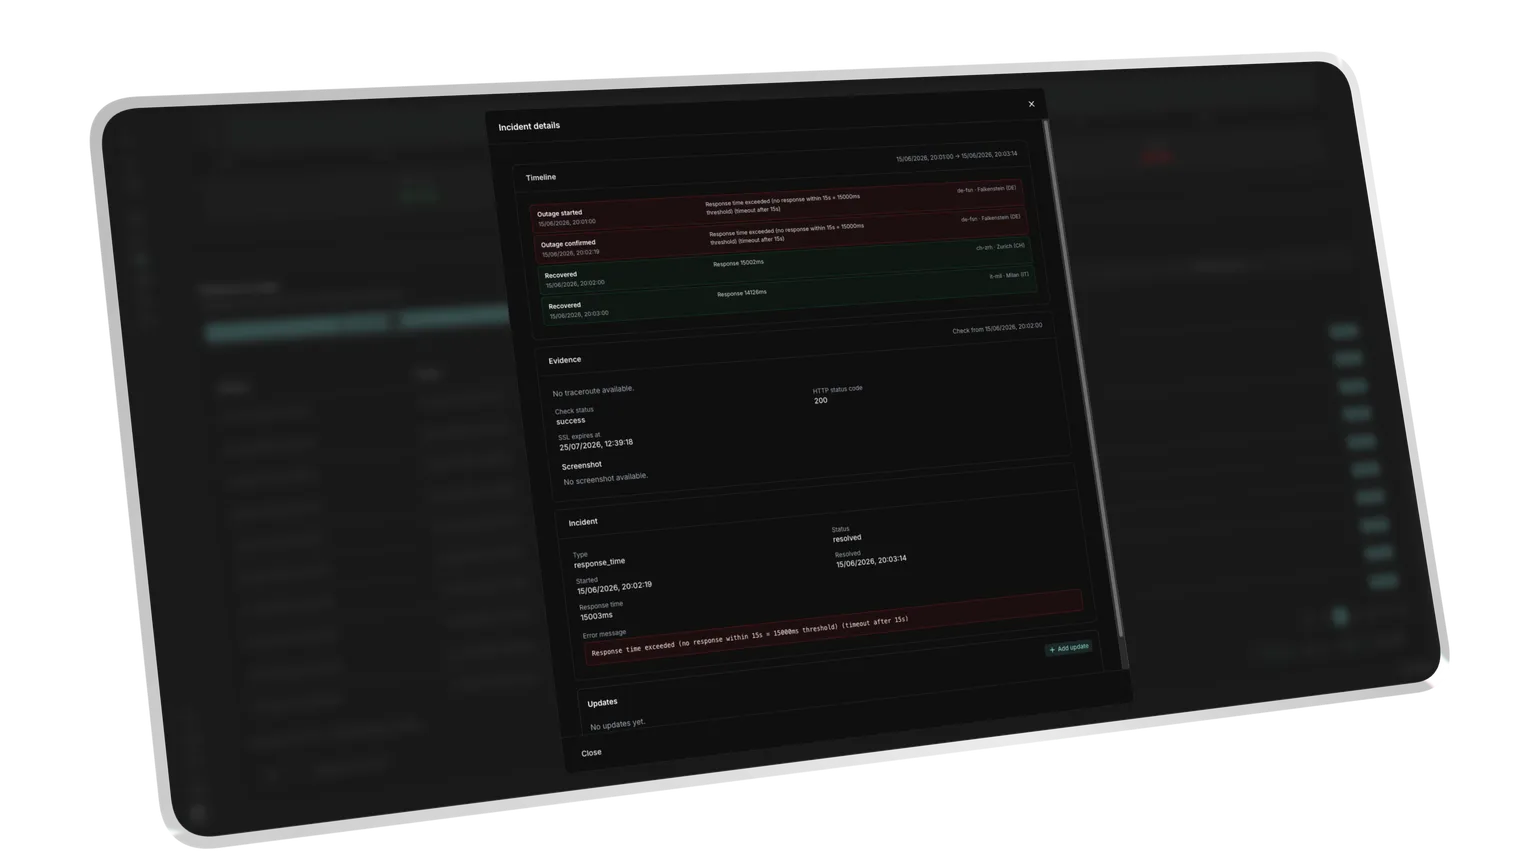
European Multi-Node Verification. Not Single-Node Panic.
One failed check isn't an outage. It's a suspicion. Uptimeify confirms every failure across multiple European nodes before a status flips to "down." That's how you catch network flicker and single-node hiccups, and never send a client an all-clear that's already stale.
- Consensus, not a single opinion, so you only alert on real outages confirmed by multiple locations.
- High-frequency HTTP/S polling, so you see an outage in seconds, not when the client calls.
- Precise status-code matching, so "online" means what you define: 2xx by default, redirects and legacy routing on your terms.
6 European nodes across DE, FR, NL, UK and FI.
A real headless Chromium re-verifies every status and network error before the alert fires.
Full Protocol Control. Not Dumb Pings.
Modern stacks are more than a homepage returning 200. You build the request the way your real endpoint expects it (method, headers, payload) and monitor authenticated APIs and protected routes, not just whatever answers without a login.
- GET, POST, HEAD and more, so you test endpoints functionally, not just for reachability.
- Custom headers and JSON payloads, so you watch
Authorization: BearerAPIs the same way you watch public pages. - Flexible success criteria, so redirects, legacy setups or a keyword in the body count as "healthy" when that's what's true for you.
Bearer token, Basic auth or mTLS, plus custom headers per monitor. Protected endpoints included.
Authorization: Bearer <token>Any request body (e.g. JSON) for POST, PUT and PATCH.
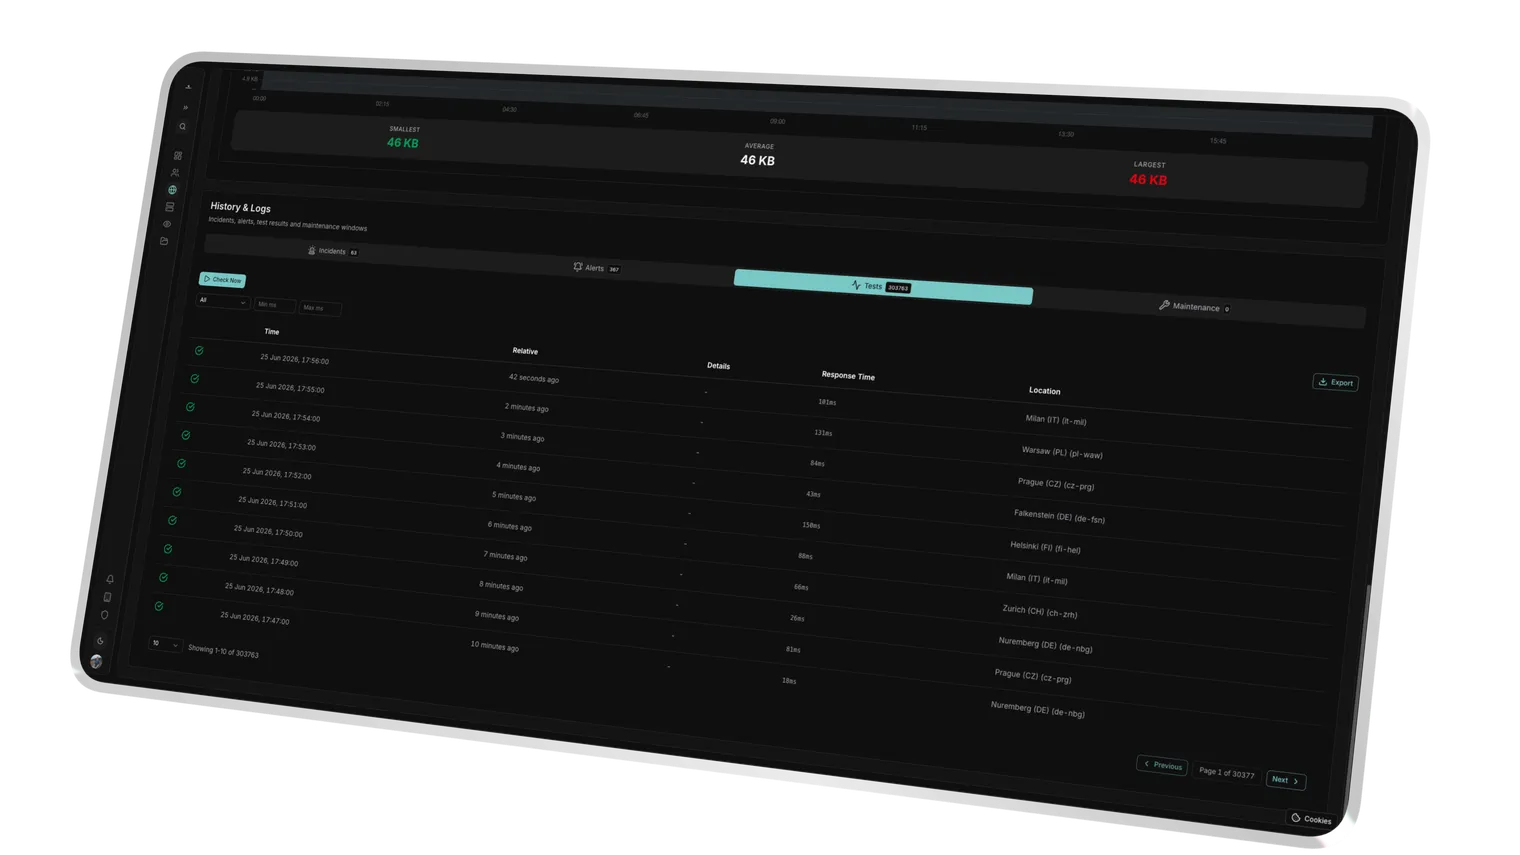
TTFB & Latency. Reachable Is Only Half the Truth.
A page that answers but crawls isn't a green status. It's an incident in slow motion. Uptimeify measures real response time on every check and flags it before slow becomes broken. So you prove performance to the client instead of claiming it.
- TTFB and latency on every check, so you see whether an endpoint is reachable and fast.
- Degraded status via thresholds, so you're warned before the client notices (e.g. > 2000 ms).
- Time series across every check, so you correlate performance dips with deploys or server load instead of guessing.
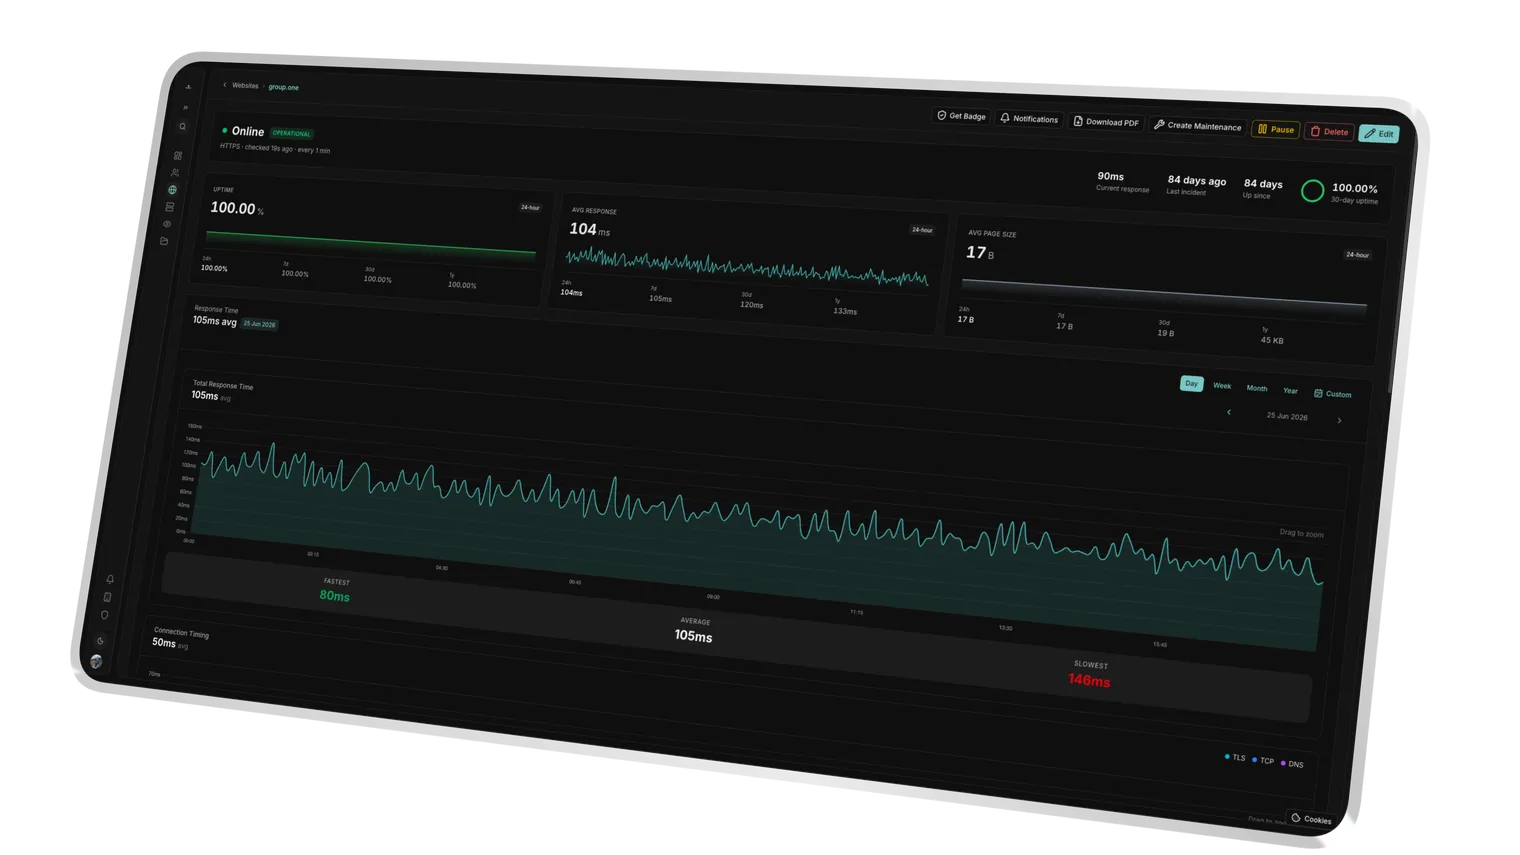
Time-series charts across week, month and year. Correlate fluctuations with server load or deployments.
You Decide Where the Checks Come From.
Where your checks originate isn't a footnote with EU clients. It's part of the pitch. Uptimeify polls from European locations (Frankfurt and other EU nodes) and you restrict, per monitor, which regions are allowed to check. That takes a whole conversation off the table in B2B and public-sector deals.
- EU polling out of Frankfurt, so your checks and their metadata run on European infrastructure, without US sub-processors.
- Per-monitor region whitelist, so you control which countries an endpoint is checked from.
- A clean answer in the sales call, so you handle location questions with facts instead of dodging them.

European polling locations; Frankfurt is an active node.
If the whitelist hits no active node, the API says so explicitly, with no silent check from a default region.
Success Kit
We don't just monitor. We help you sell.
Every Uptimeify subscription includes access to our Success Kit, a collection of battle-tested resources to turn your monitoring into a profit center.
Service Level Agreement templates to define professional boundaries with your clients.
Find the sweet spot for your care plans. Calculate margins based on check frequency and support hours.
Powerpoint Templates that explain 24/7 monitoring to non-technical clients. Close more retainers.
Use automated reports to proactively communicate value, so clients never ask what they're paying for.
Ready to turn monitoring into a profit center?
Claim your Success Kit and start scaling today.
Frequently Asked Questions
Before an alert goes out, Uptimeify re-checks the failure across multiple EU nodes. You're only notified once several locations confirm it. That catches network flicker and single-node hiccups, and spares your client the false alarm that's already stale by the time it lands.
You set the polling interval per monitor, from 1 minute to 24 hours, depending on plan and SLA. Tight intervals catch outages in near real time; wider ones save resources on non-critical sites. You steer it per endpoint instead of relying on one global default.
Yes. You configure the HTTP method, custom headers and a request body freely, including Authorization: Bearer or basic auth. So you monitor the login flow, a health endpoint or a protected API as precisely as the public homepage. Headers and credentials are stored encrypted.
Polling runs from European locations, with Frankfurt as an active node. The infrastructure is European-only, without US sub-processors, which minimizes third-country transfer risk and takes a discussion off the table in B2B and public-sector pitches. Per monitor, you can narrow the checking regions to a country whitelist on top.
Yes. Every check captures Time to First Byte (TTFB) and full response time. Cross your threshold and Uptimeify automatically marks the endpoint as "degraded", so you step in before slow turns into an outage. The time series lets you correlate dips with deploys or server load.
Ready to React to Real Outages Only?
No more false alarms waking your team at 3 a.m. and rattling your client. EU-wide polling, multi-node verification and full protocol control, under your own brand.