A Platform You Can See Into. No Black Box.
Docs, API reference, worker IPs and a public roadmap in one place, the operational layer behind reliable agency delivery. Your team integrates cleanly, whitelists without guesswork, and talks to clients with substance instead of support threads.
Made and Hosted in the
European Union
GDPR-Compliant Hosting
in Germany
GEO-Redundant Replica
across the EU
Documentation That Carries Delivery. Not Just Describes It.
Platform support should remove friction, not relocate it. Our docs fold implementation detail and operational answers into one workspace, where your team finds in seconds what otherwise drowns in support threads.
- Hands-on setup guides, so you configure monitors without waiting on a reply thread.
- One reliable knowledge base, so engineering and support decide from the same source.
- Best-practice frameworks for complex portfolios, so your monitoring stays stable across hundreds of client sites.
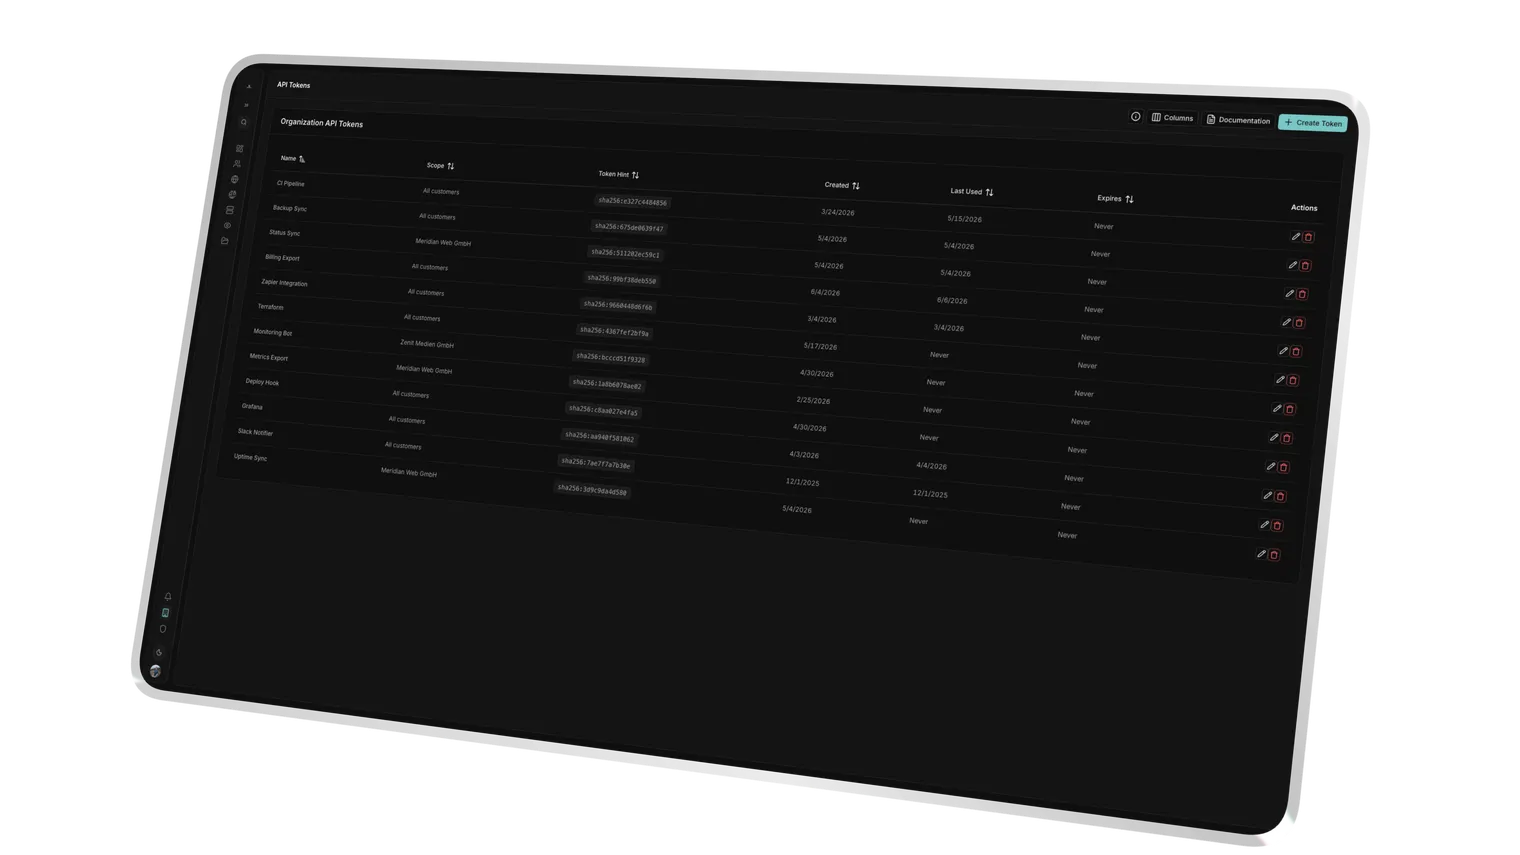
The Technical Reference for Your Developers. No Reverse-Engineering.
Deep integrations start with clear documentation. The API reference gives your developers everything they need to wire into your internal tools: predictable, testable, and with no guessing what an endpoint returns.
- A RESTful surface area, so you drive customer management, asset sync and status queries through clear, predictable endpoints.
- A try-it-out interface, so you validate requests and payloads right in the docs before writing code.
- Structured JSON responses, so the integration into internal portals stays fast and maintainable.
Whitelisting Without Guesswork. No Blocked Checks.
Clear infrastructure boundaries instead of guesswork: hand your team every IP detail up front, so launches, migrations and firewall reviews run clean, and no monitor fails against an allowlist nobody knew about.
- Precise IP lists, so firewalls, WAF rules and client allowlists let monitoring traffic through instead of blocking it.
- Node-level visibility, so you know exactly which locations check from, and explain it to your client transparently.
- Operational safety on rollout, so misjudgments at launch or migration don't happen, because the infrastructure layer is documented.
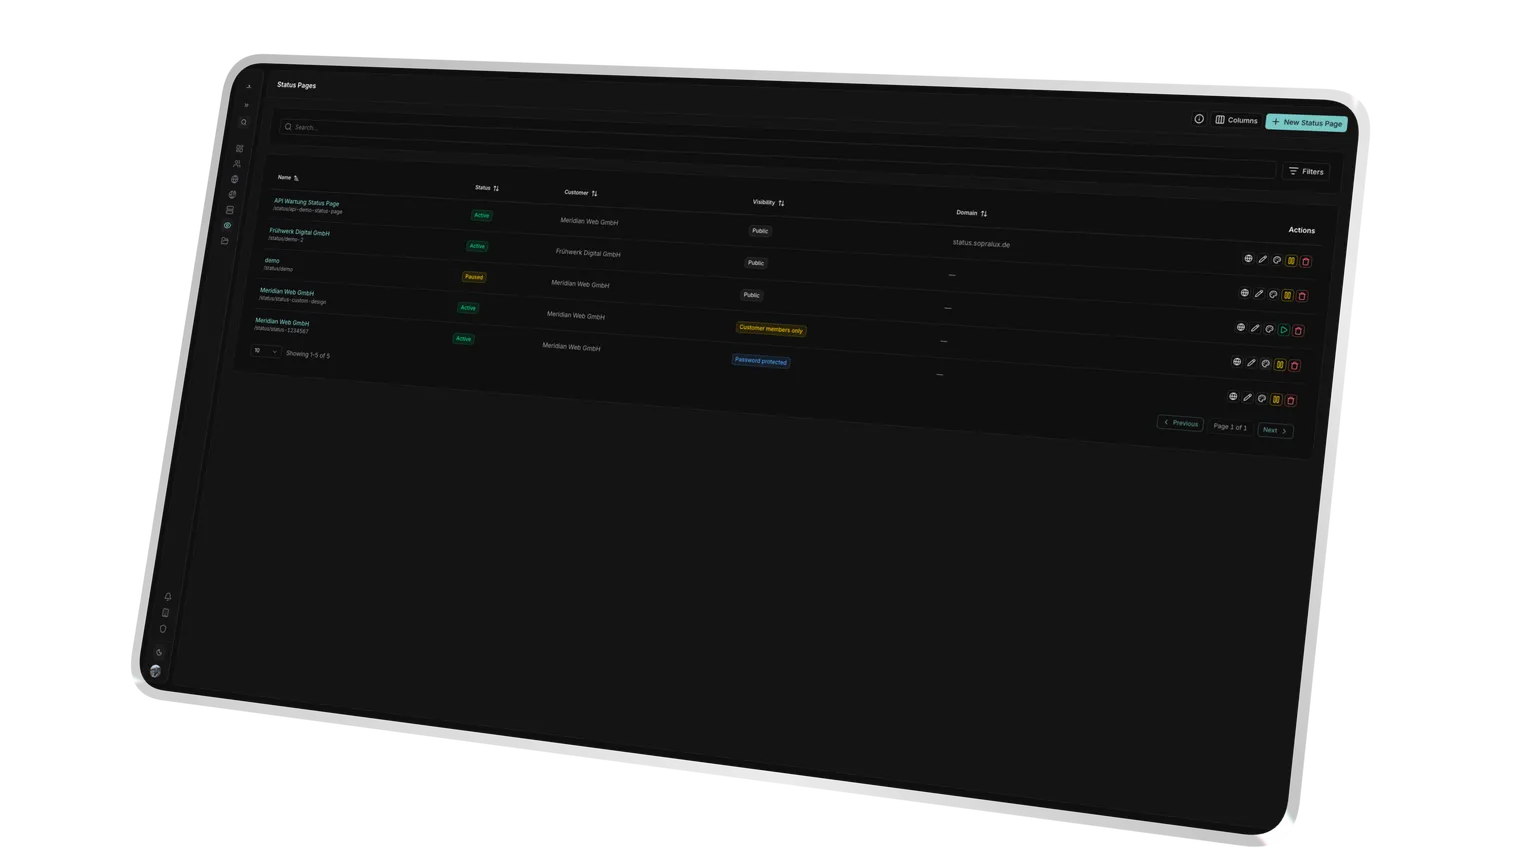
A Roadmap You Can Show Your Clients. No Closed Door.
Support is stronger when product development is visible. Our public roadmap shows what's in progress, what's planned and what already shipped, and hands you an argument no competitor with a black-box backlog can counter.
- Visible progress, so you prove to clients that your platform keeps moving instead of claiming it.
- Active feature voting, so your priorities feed into development, not just your feedback.
- Strategic planning certainty, so you plan migrations ahead and sell new features to your clients proactively.
One Vocabulary for You and Your Client. No Translation Work.
TTFB, multi-node, polling interval, DNSBL: monitoring comes with its own vocabulary, and in a client call, every fuzzy term turns into a follow-up question. The glossary gives you clean definitions you can lift straight into reports and pitches.
- Precise definitions, so you explain in the client meeting instead of improvising.
- Consistent language across your team, so sales, support and engineering mean the same thing when they say the same word.
- Plain-English explanations for end clients, so your report builds trust instead of opening questions.
Success Kit
We don't just monitor. We help you sell.
Every Uptimeify subscription includes access to our Success Kit, a collection of battle-tested resources to turn your monitoring into a profit center.
Service Level Agreement templates to define professional boundaries with your clients.
Find the sweet spot for your care plans. Calculate margins based on check frequency and support hours.
Powerpoint Templates that explain 24/7 monitoring to non-technical clients. Close more retainers.
Use automated reports to proactively communicate value, so clients never ask what they're paying for.
Ready to turn monitoring into a profit center?
Claim your Success Kit and start scaling today.
Frequently Asked Questions
Not to get started: setup, Slack or Teams connectors and worker-IP whitelisting are walked through step by step in the docs. For deeper integrations, the REST API with its try-it-out interface is ready, so your technical team wires in without reverse-engineering endpoints.
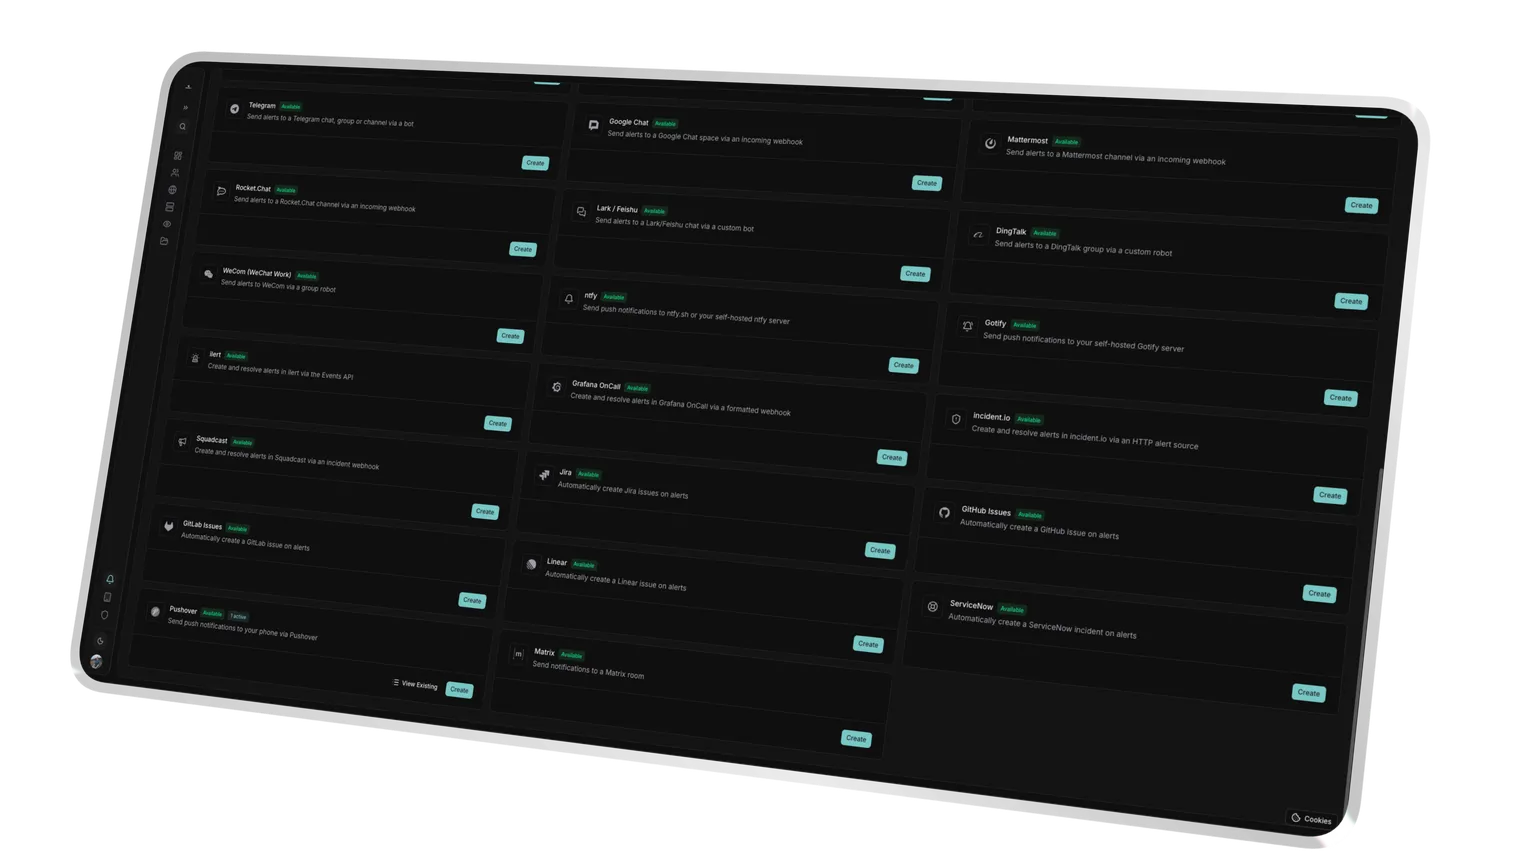
Native connectors cover Slack, Microsoft Teams, Discord and PagerDuty; beyond those, you react to any status change with freely configurable webhooks. So every alert lands where your team already works, instead of fading out in an inbox.
The monitoring nodes' worker IPs are documented as an explicit list and available through the platform. You drop them straight into firewalls, WAF rules and client allowlists, so no check fails against a clearance nobody knew about.
Checks run from European nodes, Frankfurt among them, European infrastructure without US sub-processors. That keeps your firewall reviews and client conversations cleanly auditable, and takes a whole data-routing discussion off the table in B2B and public-sector pitches.
Yes. Every feature on the public roadmap has open voting, your vote feeds straight into prioritization. At the same time you see in the open what's planned and what shipped, so you plan migrations ahead and sell new features to your clients proactively.
Ready for a Platform That Hides Nothing?
Docs, API, worker IPs and roadmap are in the open, the operational layer behind your delivery, visible from day one. Build your monitoring on substance, not on support tickets.